Resource
| Id | gene_properties/gene_scores/Satterstrom_Buxbaum_Cell_2020 |
|---|---|
| Type | gene_score |
| Version | 0 |
| Summary | TADA derived gene-autism association score |
| Description |
See https://www.cell.com/cell/pdf/S0092-8674(19)31398-4.pdf. |
| Labels |
Scores (1)
| ID | Type | Description | Histograms | Range | Summary |
|---|---|---|---|---|---|
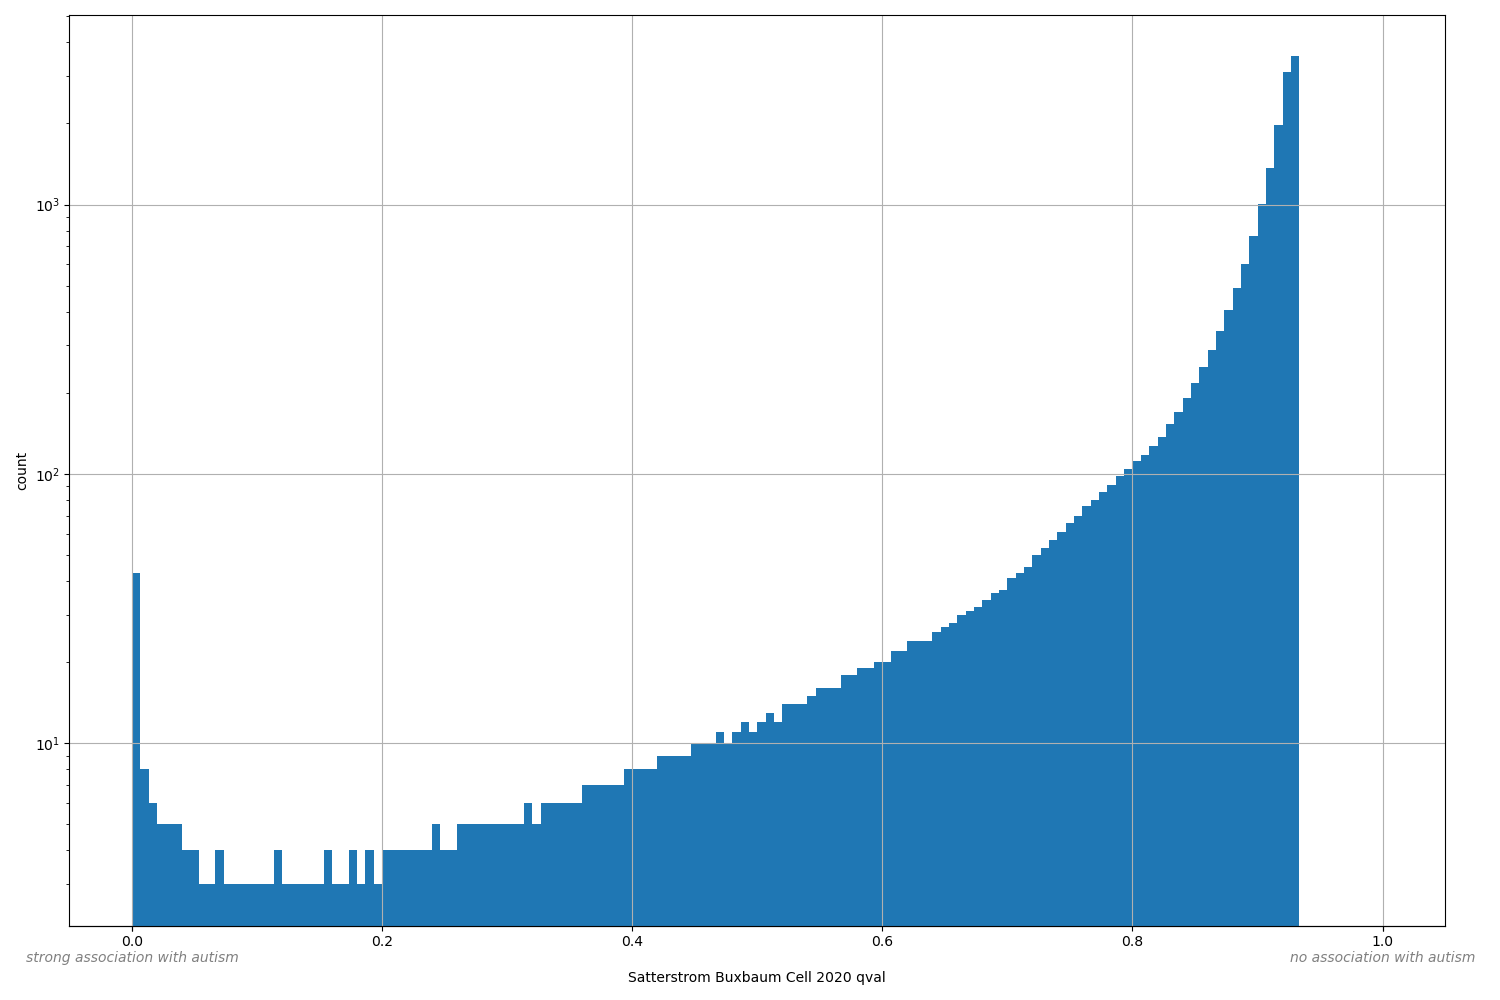
| Satterstrom Buxbaum Cell 2020 qval |
Multiple hypothesis adjusted p-value for gene-autism association
Small values desc: strong association with autism
Large values desc: no association with autism
|
|
[0, 0.931] |
|
n counts genes; sd is the population standard deviation.
Files
| Filename | Size | md5 |
|---|---|---|
| Satterstrom_Buxbaum_Cell_2020_autosomal_qvalue.csv | 264.62 KB | 4a4be0e1551049e1a2f3c92b135a710c |
| Satterstrom_Buxbaum_Cell_2020_autosomal_qvalue.txt | 331.03 KB | 579c30e54d882e9b7803f21daac437b5 |
| genomic_resource.yaml | 628.0 B | 14d73cf015e556fc5de65c20a8fe4a25 |
| statistics/ |